


Data mining and algorithms
Data mining is the process of discovering predictive information from the analysis of large databases. For a data scientist, data mining can be a vague and daunting task – it requires a diverse set of skills and knowledge of many data mining techniques to take raw data and successfully get insights from it. You’ll want to understand the foundations of statistics and different programming languages that can help you with data mining at scale.
This guide will provide an example-filled introduction to data mining using Python, one of the most widely used data mining tools – from cleaning and data organization to applying machine learning algorithms. First, let’s get a better understanding of data mining and how it is accomplished.
A data mining definition
The desired outcome from data mining is to create a model from a given data set that can have its insights generalized to similar data sets. A real-world example of a successful data mining application can be seen in automatic fraud detection from banks and credit institutions.
Your bank likely has a policy to alert you if they detect any suspicious activity on your account – such as repeated ATM withdrawals or large purchases in a state outside of your registered residence. How does this relate to data mining? Data scientists created this system by applying algorithms to classify and predict whether a transaction is fraudulent by comparing it against a historical pattern of fraudulent and non-fraudulent charges. The model “knows” that if you live in San Diego, California, it’s highly likely that the thousand dollar purchases charged to a scarcely populated Russian province were not legitimate.
That is just one of a number of the powerful applications of data mining. Other applications of data mining include genomic sequencing, social network analysis, or crime imaging – but the most common use case is for analyzing aspects of the consumer life cycle. Companies use data mining to discover consumer preferences, classify different consumers based on their purchasing activity, and determine what makes for a well-paying customer – information that can have profound effects on improving revenue streams and cutting costs.
What are some data mining techniques?
There are multiple ways to build predictive models from data sets, and a data scientist should understand the concepts behind these techniques, as well as how to use code to produce similar models and visualizations. These techniques include:
Regression – Estimating the relationships between variables by optimizing the reduction of error.

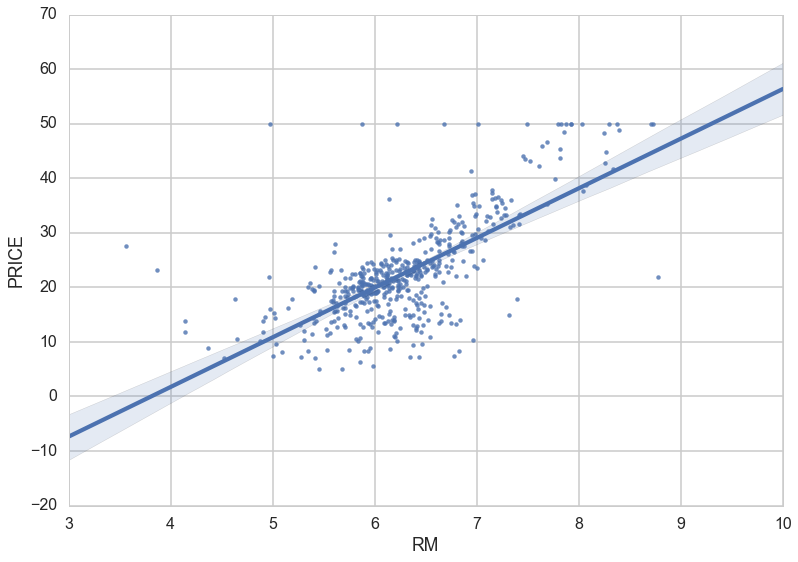
An example of a scatterplot with a fitted linear regression model.
- Classification – Identifying what category an object belongs to. An example is classifying email as spam or legitimate, or looking at a person’s credit score and approving or denying a loan request.
- Cluster Analysis – Finding natural groupings of data objects based upon the known characteristics of that data. An example could be seen in marketing, where analysis can reveal customer groupings with unique behavior – which could be applied in business strategy decisions.

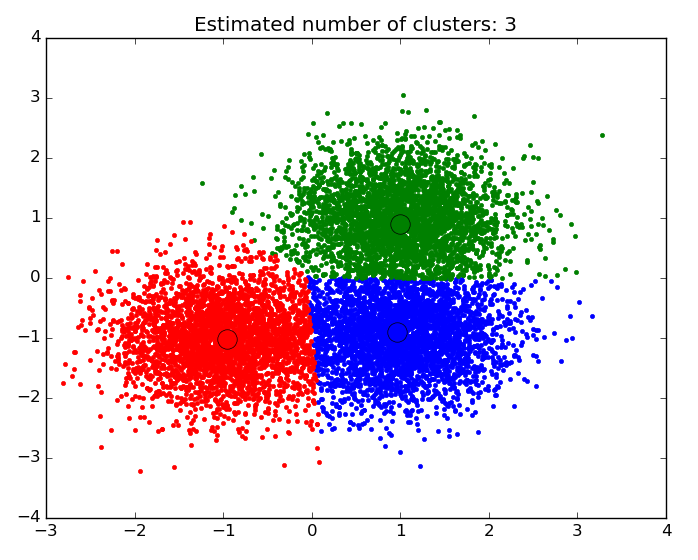
An example of a scatter plot with the data segmented and colored by cluster.
- Association and Correlation Analysis – Looking to see if there are unique relationships between variables that are not immediately obvious. An example would be the famous case of beer and diapers: men who bought diapers at the end of the week were much more likely to buy beer, so stores placed them close to each other to increase sales.
- Outlier analysis – Examining outliers to examine potential causes and reasons for said outliers. An example of which is the use of outlier analysis in fraud detection, and trying to determine if a pattern of behavior outside the norm is fraud or not.
Data mining for business is often performed with a transactional and live database that allows easy use of data mining tools for analysis. One example of which would be an On-Line Analytical Processing server, or OLAP, which allows users to produce multi-dimensional analysis within the data server. OLAPs allow for business to query and analyze data without having to download static data files, which is helpful in situations where your database is growing on a daily basis. However, for someone looking to learn data mining and practicing on their own, an iPython notebook will be perfectly suited to handle most data mining tasks.
Let’s walk through how to use Python to perform data mining using two of the data mining algorithms described above: regression and clustering.
Creating a regression model in Python
What is the problem we want to solve?
We want to create an estimate of the linear relationship between variables, print the coefficients of correlation, and plot a line of best fit. For this analysis, I’ll be using data from the House Sales in King’s County data set from Kaggle. If you’re unfamiliar with Kaggle, it’s a fantastic resource for finding data sets good for practicing data science. The King’s County data has information on house prices and house characteristics – so let’s see if we can estimate the relationship between house price and the square footage of the house.
Creating a regression model in Python
What is the problem we want to solve?
We want to create an estimate of the linear relationship between variables, print the coefficients of correlation, and plot a line of best fit. For this analysis, I’ll be using data from the House Sales in King’s County data set from Kaggle. If you’re unfamiliar with Kaggle, it’s a fantastic resource for finding data sets good for practicing data science. The King’s County data has information on house prices and house characteristics – so let’s see if we can estimate the relationship between house price and the square footage of the house.
First step: Have the right data mining tools for the job – install Jupyter, and get familiar with a few modules.
First things first, if you want to follow along, install Jupyter on your desktop. It’s a free platform that provides what is essentially a processer for iPython notebooks (.ipynb files) that is extremely intuitive to use. Follow these instructions for installation. Everything I do here will be completed in a “Python [Root]” file in Jupyter.
We will be using the Pandas module of Python to clean and restructure our data. Pandas is an open-source module for working with data structures and analysis, one that is ubiquitous for data scientists who use Python. It allows for data scientists to upload data in any format, and provides a simple platform organize, sort, and manipulate that data. If this is your first time using Pandas, check out this awesome tutorial on the basic functions!
In [1]:
import pandas as pd
import matplotlib.pyplot as plt
import numpy as np
import scipy.stats as stats
import seaborn as sns
from matplotlib import rcParams

%matplotlib inline
%pylab inline
Populating the interactive namespace from numpy and matplotlib
In the code above I imported a few modules, here’s a breakdown of what they do:
- Numpy – a necessary package for scientific computation. It includes an incredibly versatile structure for working with arrays, which are the primary data format that scikit-learn uses for input data.
- Matplotlib – the fundamental package for data visualization in Python. This module allows for the creation of everything from simple scatter plots to 3-dimensional contour plots. Note that from matplotlib we install pyplot, which is the highest order state-machine environment in the modules hierarchy (if that is meaningless to you don’t worry about it, just make sure you get it imported to your notebook). Using ‘%matplotlib inline’ is essential to make sure that all plots show up in your notebook.
- Scipy – a collection of tools for statistics in python. Stats is the scipy module that imports regression analysis functions.
Let’s break down how to apply data mining to solve a regression problem step-by-step! In real life you most likely won’t be handed a dataset ready to have machine learning techniques applied right away, so you will need to clean and organize the data first.
In [2]:
df = pd.read_csv('/Users/michaelrundell/Desktop/kc_house_data.csv')
df.head()
Out[2]:
| id | date | price | bedrooms | bathrooms | sqft_living | sqft_lot | |
|---|---|---|---|---|---|---|---|
| 0 | 7129300520 | 20141013T000000 | 221900.0 | 3 | 1.00 | 1180 | 5650 |
| 1 | 6414100192 | 20141209T000000 | 538000.0 | 3 | 2.25 | 2570 | 7242 |
| 2 | 5631500400 | 20150225T000000 | 180000.0 | 2 | 1.00 | 770 | 10000 |
| 3 | 2487200875 | 20141209T000000 | 604000.0 | 4 | 3.00 | 1960 | 5000 |
| 4 | 1954400510 | 20150218T000000 | 510000.0 | 3 | 2.00 | 1680 | 8080 |
Reading the csv file from Kaggle using pandas (pd.read_csv).